2015
Agent / Broker
Merger & Acquisition Statistics
Another Record Setting Year
Prepared by OPTIS Partners
Explanation and sources of data:
Data is for U.S. and Canadian transactions in the insurance distribution sector for both retail and wholesale producers, including managing general agencies/managing general underwriters (MGA/MGU). These agencies and brokers provide property/casualty (P.C) insurance, employee benefits (EB), or any combination thereof.
Firms with private equity (PE) backing are identified in the chart on p. 8 and Exhibit E1 on p. 18
An appendix of tables follows the report beginning on p. 13
Data for reported and announced transactions have been obtained from various sources, including press releases, trade press articles, company websites and direct communications with buyers.
Agent / Broker Mergers & Acquisitions
Merger and acquisition (M&A) activity again reached record levels in 2015 and provided further evidence of a steady, entrenched shift in buyer dynamics. PE-backed buyers were responsible for virtually all of the year-over-year growth, while P&C agencies dominated the seller category.
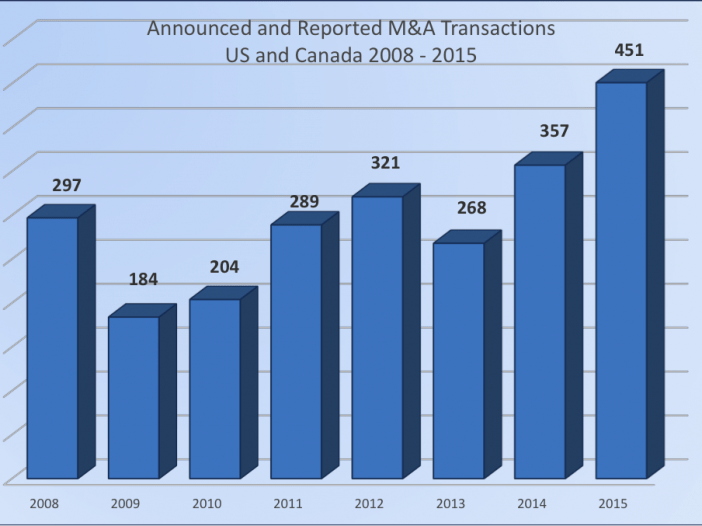
With 451 transactions in the United States and Canada, 2015’s M&A activity was far and away the most robust over the last eight years. The actual number of sales was greater, as many buyers and sellers do not report transactions, and some acquirers do not report small transactions. The referenced data base tracks a consistent pool of the most active acquirers, including other announced deals, and is therefore a reasonably accurate indication of deal activity in the sector. Even so, the 26% one-year increase in activity in 2015 ranks second only to 2014’s 33% spike, a portion of which is attributable to a singular tax-fueled drop-off in deals in 2013. The number of deals during the first three quarters that year fell appreciably after sellers had scrambled to close their deals in 2012’s fourth quarter to avoid an impending capital gains tax increase the following year.


